AutoStructure Theory: Difference between revisions
No edit summary |
No edit summary |
||
| Line 1: | Line 1: | ||
<span style="font-size: 11pt; font-family: Arial;">AutoStructure [1,2,3] is an automated NOESY assignment engine, which <span | <span style="font-size: 11pt; font-family: Arial;">AutoStructure [1,2,3] is an automated NOESY assignment engine, which <span style="font-family: sans-serif; font-size: 13px;" class="Apple-style-span"><span lang="FR" style="font-size: 11pt; font-family: Arial;">uses a distinct bottom-up</span> topology-constrained approach for iterative NOE interpretation and structure determination. <span style="font-size: 11pt; font-family: Arial;">AutoStructure first builds an initial chain fold based on | ||
intraresidue and sequential NOESY data, together with characteristic NOE | intraresidue and sequential NOESY data, together with characteristic NOE | ||
patterns of secondary structures, including helical medium-range NOE | patterns of secondary structures, including helical medium-range NOE | ||
| Line 13: | Line 13: | ||
generation on a Linux-based computer cluster.</span> | generation on a Linux-based computer cluster.</span> | ||
<span style="font-size: 11pt; font-family: Arial;">This ‘bottom up’ strategy is quite different from the “top down” | <span style="font-size: 11pt; font-family: Arial;">This ‘bottom up’ strategy is quite different from the “top down” | ||
| Line 96: | Line 96: | ||
style='mso-element:field-separator'></span></span><![endif]--><span style="font-size: 11pt; font-family: Arial;">[83]</span><!--[if supportFields]><span | style='mso-element:field-separator'></span></span><![endif]--><span style="font-size: 11pt; font-family: Arial;">[83]</span><!--[if supportFields]><span | ||
style='font-size:11.0pt;mso-bidi-font-size:12.0pt;font-family:Arial'><span | style='font-size:11.0pt;mso-bidi-font-size:12.0pt;font-family:Arial'><span | ||
style='mso-element:field-end'></span></span><![endif]--><span style="font-size: 11pt; font-family: Arial;">. </span> | style='mso-element:field-end'></span></span><![endif]--><span style="font-size: 11pt; font-family: Arial;">. </span><span /> | ||
< | <br> | ||
<span>Fig. 1 shows AutoStructure results for three different human protein NMR | <span>Fig. 1 shows AutoStructure results for three different human protein NMR | ||
| Line 105: | Line 105: | ||
determined by AutoStructure and by manual analysis (0.5 to 0.8 Å for backbone | determined by AutoStructure and by manual analysis (0.5 to 0.8 Å for backbone | ||
atoms of ordered residues) demonstrate good accuracy of these automated | atoms of ordered residues) demonstrate good accuracy of these automated | ||
methods. <span style="color: blue; | methods. <span style="color: blue;" /></span><!--EndFragment--><br> | ||
<span>[[Image:AS.jpg|left|307x229px|Ribbon diagrams of representative structures of FGF-2, MMP-1 and IL-13 proteins used for the validation of the AutoStructure process]]</span> | <span>[[Image:AS.jpg|left|307x229px|Ribbon diagrams of representative structures of FGF-2, MMP-1 and IL-13 proteins used for the validation of the AutoStructure process]]</span> | ||
<br> | |||
{| cellspacing="1" cellpadding="1" border="1" style="width: 427px; height: 137px;" | {| cellspacing="1" cellpadding="1" border="1" style="width: 427px; height: 137px;" | ||
Revision as of 22:00, 17 December 2009
AutoStructure [1,2,3] is an automated NOESY assignment engine, which uses a distinct bottom-up topology-constrained approach for iterative NOE interpretation and structure determination. AutoStructure first builds an initial chain fold based on intraresidue and sequential NOESY data, together with characteristic NOE patterns of secondary structures, including helical medium-range NOE interactions and interstrand b-sheet NOE interactions, and unambiguous long-range NOE interactions, based on chemical shift matching and NOESY spectral symmetry considerations. NOESY cross peaks that cannot be uniquely assigned using these methods are not used in the initial structure calculations. Once initial structures are generated and validated, additional NOESY cross peaks are iteratively assigned using the intermediate 3D structures and contact maps, together with knowledge of high-order topology constraints of alpha-helix and beta-sheet packing geometries [4]. This protocol, in principle, resembles the method that an expert would utilize in manually solving a protein structure by NMR. The input data for AutoStructure are: (i) resonance assignment table, (ii) 2D, 3D, and/or 4D NOESY peak lists, (iii) list of scalar coupling, RDC and slow amide exchange data. AutoStructure generates distance constraint lists and utilizes the programs DYANA/CYANA, Xplor for 3D structure generation on a Linux-based computer cluster.
This ‘bottom up’ strategy is quite different from the “top down” strategies used by the alternative programs CANDID and ARIA, which rely on “ambiguous constraints”. For NOESY spectra with poor signal-to-noise ratios, such automatically assigned ‘ambiguous constraint” sets may not include any true NOESY assignments, and result in distortions of the protein structure which can be avoided by the “bottom up” approach of AutoStructure [4]. CANDID/CYANA also uses a ‘network anchoring” approach similar to, but less comprehensive than, the topology-constrained approach used by AutoStructure [4]. For these reasons, some users may prefer to use both AutoStructure and CANDID/CYANA or ARIA in parallel to assess potential errors in automated NOESY cross peak assignments [83]. <span />
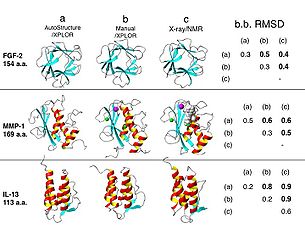
Fig. 1 shows AutoStructure results for three different human protein NMR
test data sets: FGF-2, IL-13 and MMP-1, ranging in size from 113 to 169
amino-acid residues. The mean coordinate differences between structures
determined by AutoStructure and by manual analysis (0.5 to 0.8 Å for backbone
atoms of ordered residues) demonstrate good accuracy of these automated
methods.
| Fig. 1. Ribbon diagrams of representative structures of FGF-2, MMP-1 and IL-13 proteins used for the validation of the AutoStructure process: (a) final structures from AutoStructure using XPLOR for stucture generation, (b) manual-analyzed structures deposited in PDB, analyzed using the same NMR data set, (c) structures determined by X-ray crystallography or third NMR group. Tabulated on the right are mean coordinate differences (Å) in secondary structure regions for backbone atoms between structures (a), (b) and (c). |
