AutoStructure
Introduction
AutoStructure is a protein structure determination tool that uses uninterpreted NOESY cross peaks together with structure calculation programs like XPLOR or DYANA to generate a 3D structure of the protein that is as close to the true structure as possible (Ref. 1). AutoStructure uses an iterative bottom-up topology-constrained approach to analyze NOE peak lists. It first builds an initial fold based on intraresidue and sequential NOESY data, together with characteristic NOE patterns of secondary structures, including helical medium-range NOE interactions and interstrand beta-sheet NOE interactions, and unique long-range packing NOE interactions based on chemical shift matching and symmetry considerations. Unassigned NOESY cross peaks are not used in structure calculations. Additional NOESY cross peaks are iteratively assigned using intermediate structures and the knowledge of high-order topology constraints of alpha-helix and beta-sheet packing geometries. This protocol, in principal, resembles the methodology that an expert would utilize in manually solving a protein structure by NMR.
The RPF program within AutoStructure uses a novel, rapid, and simple approach for calculating global structure quality scores (Ref. 2). Specifically, this program calculates RECALL, PRECISION, and F-MEASURE (RPF) scores for the query structures, which are statistical quality scores commonly used in the field of information retrieval. These scores quickly provide the goodness-of-fit of the query structures when compared to the NOESY peak lists and resonance assignment data. The program also presents false positive and false negative data that can be used in refining the NMR structure determination protocols.
The input for AutoStructure/RPF includes the amino acid sequence, a list of resonance assignments, lists of 3D and/or 4D-NOESY cross peaks. Query structure(s) are needed for RPF.
As of Nov. 2009, the latest manual for AutoStructure covers version 2.1.1; the current version of the prgram is 2.2.1. This version does not support structure calculations on dimers or including RDC's; a new version of the program is in development, and will support these options.
Getting Started
Input Files
The following files are required to perform an AutoStructure run.
Protein sequence file
The sequence file must be in the following format:
1   @   MET    2   @   GLU    3   @   PHE    4   @   PRO    5   @   ASP
6   @   LEU    7   @   THR    8   @   VAL    9   @   GLU    10   @   ILE
....etc.
Here is an example sequence file.
Chemical shift assignment file
The chemical shift assignments for the protein must be in BMRB 2.1 format. The header information is ignored.
AutoSructure does interpret the ambiguity code column. This is important for denoting stereospecific assignments.
1       1       Met     HA      H       3.999   .       1
2       1       Met     HB2     H       2.011   .       2
3       1       Met     HB3     H       1.946   .       2
4       1       Met     HG2     H       2.368   .       2
5       1       Met     HG3     H       2.274   .       2
6       1       Met     CA      C       55.110  .       1
7       1       Met     CB      C       33.147  .       1
8       1       Met     CG      C       30.951  .       1
9       2       Glu     HA      H       4.548   .       1
....etc.
Here is an example bmrb file.
NOESY peak lists
AutoStructure can accept 3D and 4D NOESY peak lists. In principle, any column formated peak list file can be read by the program; we typically use either Sparky or Xeasy formats.
Here are example 15N-edited NOESY and 13C-edited NOESY peak lists.
The column definitions and tolerances are defined in the control file (see below).
Other input files
Other files that can be included in an AutoStructure calculation inlcude:
- HN-Hα J-couplings: used for initial secondary structure anlysis
- slow exchanging NH list: used for initial secondary structrue anlysis
- dihedral angle constraints: used directly in CYANA/XPLOR structure calculations
- maunal distance constraints: used directly in CYANA/XPLOR structure calculations
Graphical User Interface
AutoStructure features a GUI which is particularly useful for preparing the control file for and subsequent analysis of structure calulations.
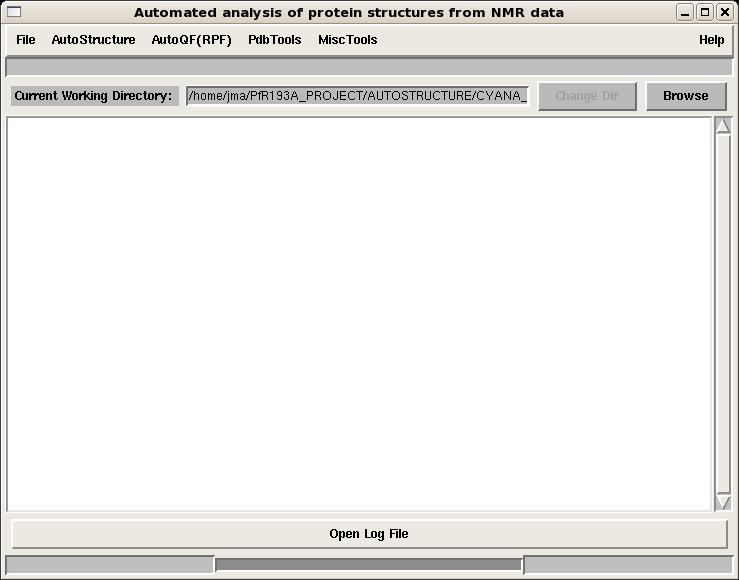
The main page (Figure 1) features the following pull-down menus:
- File: manipulation of control file
- AutoStructure: starting an AutoStructure run and analysis of an output directory
- AutoQF(RPF): starting an RPF analysis and analysis of an RPF directory
- PDB Tools: tools for converting PDB coordinates to IUPAC format
- Misc Tools
Figure 1: AutoStructure main page
Control File
The control file is the central file which defines the input, parameter, and execution files and options for an AutoStructure run.
It is easiest to manipulate the control file using the GUI. The control file in the GUI is subdivided into three main sections:
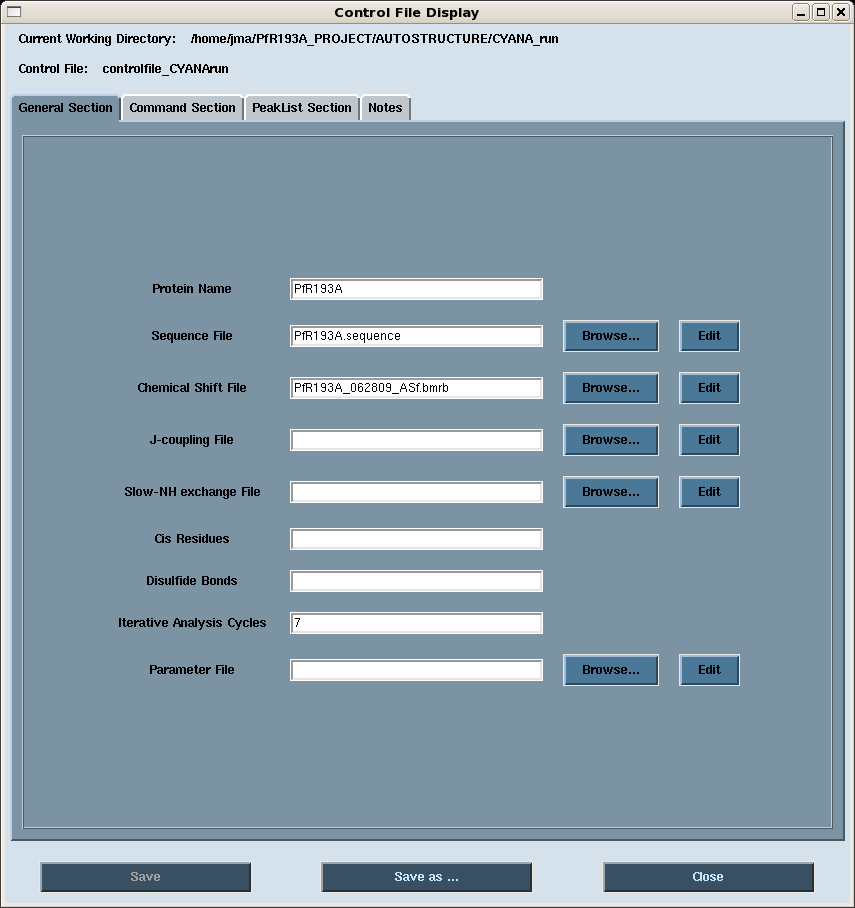
- General: general input files for the AutoStructure run (Figure 2).
Figure 2: AutoStructure control file: General Section
- Command: specific command input and selections for the AutoStructure run. This will be discussed in another section.
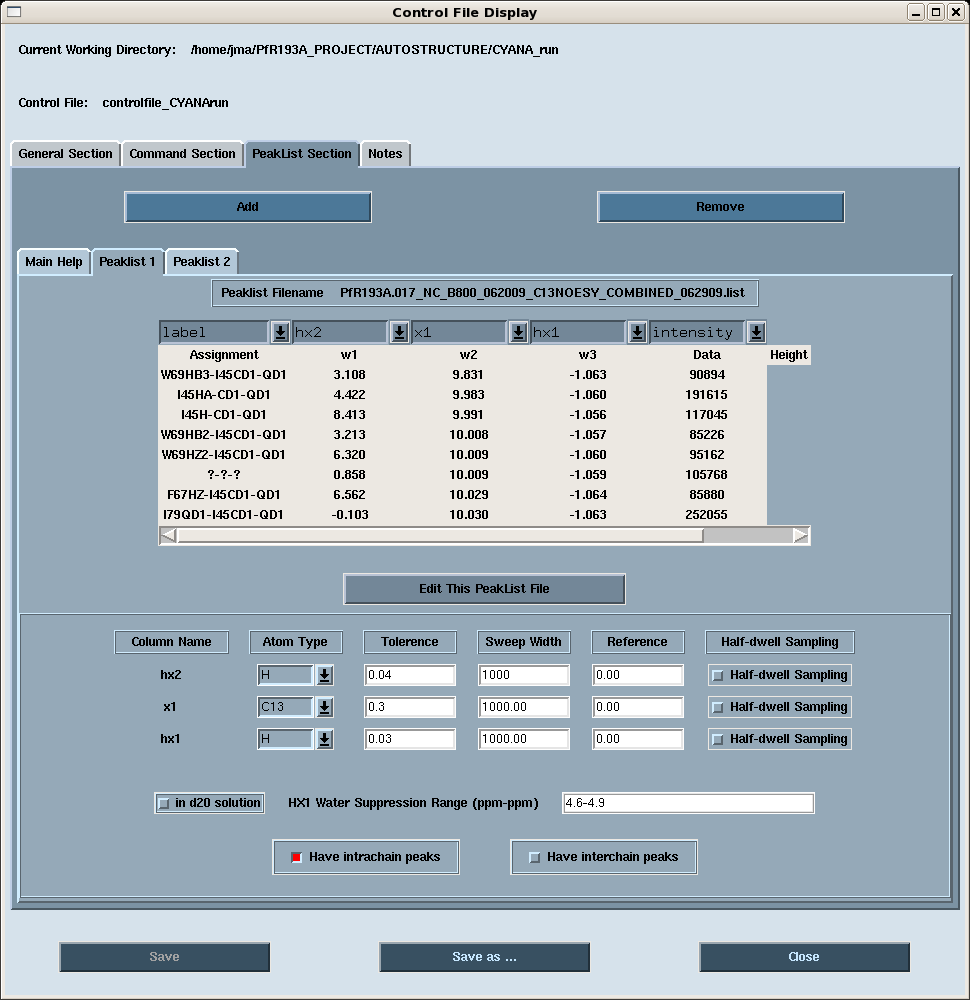
- Peak Lists: peak lists for the AutoStructure run (Figure 3). Note that AutoStructure can take into account aliasing in any dimension; simply enter the sweep width of the aliased dimesnion(s). Also, we generally combine aliphatic and aromatic 13C-edited NOESY peak lists into a single list for an AutoStructure run.
Figure 3: AutoStructure control file: PeakList Section
Starting a Calculation
The user can start a calculation from either the graphical user face or the command line.
1. Launching a calculation from the GUI.
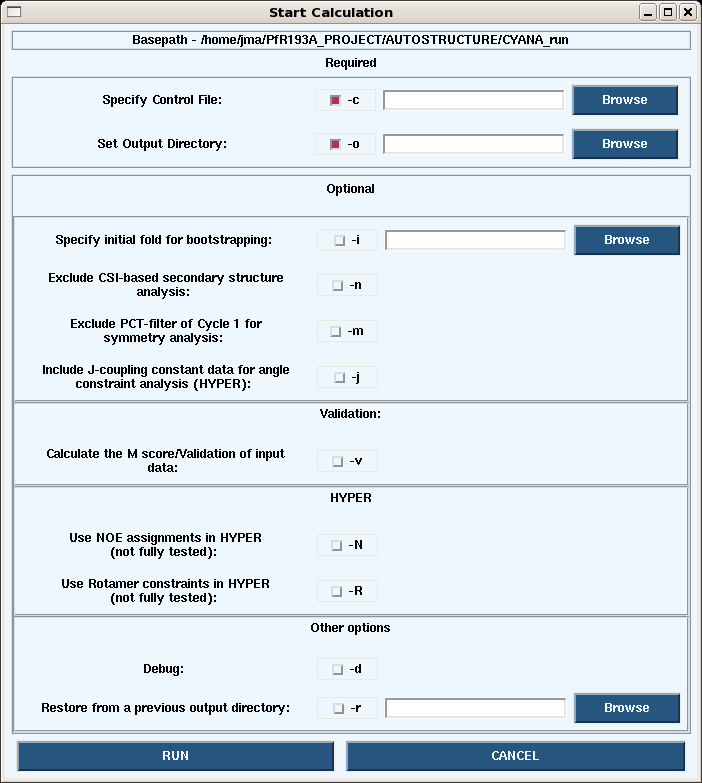
- Under the Autostructure pull-down on the main page, choosing Start -> Calc opens the dialogue box below.
- Launching calculations from the GUI uses is generally slow since only the processors on your own machine are used. To speed up the calculations use the command line on a cluster.
2. Launching a calculation from the command line.
- Login in the a cluster. At CABM we use AutoStructure version 2.2.1 on hummer.
- A simple command line run can be started as follows:
/farm/software/AutoStructure/AutoStructure-2.2.1/bin/autostructure -c controlfile_CYANArun -o testCYANArun.out -v
- Running the autostructure command gives the following options (like those avaliable in the GUI):
 AutoStructure/RPF Version 2.2.1 Copyright(C) 2007
     Center for Advanced Biotechnology and Medicine (CABM)
     Rutgers University

     Options:
         -c control_file      Required
         -o output_dir        Required
         -d                   For debug
         -h                   Help
         -m                   Exclude PCT-filter of Cycle1 for symmetry analysis
         -n                   Exclude CSI-based secondary structure analysis
         -i structure_file    inital fold for bootstrapping
         -j                   Include J-coupling constant data for angle constraint analysis (HYPER)
         -k float_number      Calibration coefficient
         -N                   Include NOE assignments in HYPER caluclation (under development)
         -q structure_file    AutoQF-Calculate the F and DP scores of the input structure_file (IUPAC naming)
         -r path              Restore from a prior outout_dir
         -R                   Include rotamer constraints in HYPER calculation (under development)
         -v                   Calculate the M score and average shifts
References
1. Huang, Y.J., Tejero, R., Powers, R. and Montelione, G.T. (2006) A topology-constrained distance network algorithm for protein structure determination from NOESY data, Proteins 62, 587-603.
2. Huang, Y.J., Powers, R. and Montelione, G.T. (2005) Protein NMR Recall, Precision, and F-measure scores (RPF scores): structure quality assessment measures based on information retrieval statistics.J. Am. Chem. Soc. 127, 1665-1674.
-- JimAramini - 07 Nov 2009


