Pulse width calibration
Calibration of 1H Carrier Frequency (tof)
To achieve the best water suppression tof has to be centered on the H2O resonance. To optimize tof:
- Load a presat or water dataset and set the following parameters:
nt=1 ss=2 satmode='y' ssfilter='n' av - Acquire a 1D spectrum with ga and expand the region around the H2O signal
- Array the parameter satfrq around the current value of tof; a range of +/- 10 Hz with a step of 1-2 Hz will suffice
- Acquire the arrayed spectra. Process and display with wft dssh dssl. The intensity of the water signal should fall, reach a minimum and then rise again. The value of satfreq at the minimum is the correct tof
- Update the probefile with the new tof value, if necessary
It is important to use a single increment (nt=1), since phase cycling will likely produce additional water suppression and obscure the optimum satfreq. The solvent subtraction filter should obviously be disabled (ssfilter='n'). Absolute-value mode (av) is better here since you don't have to phase the spectrum.
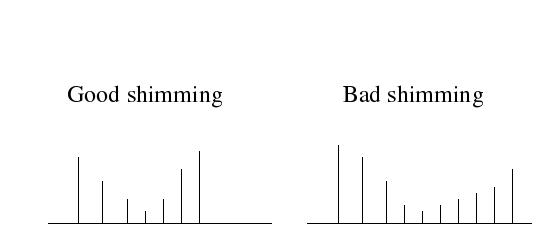
The water signal profile can be indicative of shimming quality: good shimming will result in a symmetric profile, while bad shimming will lead to an asymmetric profile.
It may be tempting to run a small tip angle 1D and simply take the water peak maximum as the tof value. This method usually yields a different value and worse water suppression than the procedure above.
Automated Calibration of 90° Pulse Widths
The 1H 90° pulse width is very sensitive to the salt content of the sample. Below are two methods for manual calibration.
1H 90° Pulse Width from 1D
To accurately calibrate 1H pw90 with a 1H 1D experiment you have to find the correct 1H pw360 and then take pw90 as pw360/4. Follow these steps:
- Load a presat or water dataset and set the following parameters:
nt=1 ss=2 satmode='y' ssfilter='n' ph - Acquire a 1D spectrum with ga and phase it to pure absorption. Expand the region of interest (either amide or aliphatic), excluding the water line
- Array the parameter pw around the expected value of 4*pw90
- Acquire the arrayed spectra. Process and display with wft dssh dssl. The intensity should be negative for pw less than pw360, go through zero at pw360 and become positive at pw greater than pw360.
- Record a spectrum with pw set to pw180. If pw360 is determined correctly the result should be near zero.
- Update the probefile with the new pw90 value, if necessary
Arraying pw directly with the aim of observing maximum signal at pw90 will not yield the true 90° pulse width. Instead it will determine the so-called "Ernst angle", which depends on the recycle delay d1 and the T1 relaxation time of the sample.
However, when working with an unknown sample it is a good idea to use the Ernst angle pulse as an estimate pw90 and then use it to properly set the array range in the pw360 method.
1H 90° Pulse Width from [15N, 1H]- or [13C, 1H]-HSQC
You can also calibrate 1H pw90 with an HSQC dataset (gNhsqc, gNfhsqc, gChsqc or gCfhsqc)
- Load an HSQC dataset. If using gChsqc select the proper type: aliphatic, aromatic, etc.
- Set nt=2 ss=4 ni=1 phase=1 calH=1.0
- Acquire the first increment, process it with FT and phase to pure absorption. Expand the region of interest.
- Array pw from 0 in steps of 1 us
- Acquire arrayed spectra and process them with wft dssh dssl. The intensity maximum will correspond to pw90.
- Update the probefile with the new pw value, if necessary
You can also set calH=2.0 - in this case the correct pw90 will correspond to zero intensity.
15N and 13C 90° Pulse Width Calibration
- Load a [15N, 1H]-HSQC dataset (gNhsqc or gNfhsqc)
- Set nt=2 ss=4 ni=1 phase=1 calN=1.0
- Acquire the first increment, process it with FT and phase to pure absorption. Expand the region of interest.
- Array pwN from around the expected 90° pulse width
- Acquire arrayed spectra and process them with wft dssh dssl. The intensity maximum will correspond to the true 90° pulse width.
- Update the probefile with the new pwN value, if necessary
You can also set calN=2.0 - in this case the correct pwN will correspond to zero intensity.
13C 90° Pulse Width Calibration
- Load the gChsqc [13C, 1H]-HSQC dataset
- Select aromatic carbon type by entring arom='y' aliph='n' alphaC='n' allC='n' lambda=0.0015
- Set F1 detection mode to ZZ-filter by typing 'ZZ='y' SE='n'
- Set nt=2 ss=2 ni=1 phase=1 calC=1.0 N15refoc='n'
- Acquire the first increment, process it with FT and phase to pure absorption and expand the aromatic region
- Set calC=2.0 and array pwC around the expected 90° pulse width
- Acquire arrayed spectra and process them with wft dssh dssl - the zero crossing will correspond to the true 90° 13C pulse width
- Update the probefile with the new pwC value, if necessary
Focusing on aromatic signals only is the most accurate way to calibrate pwC, since adverse effects due to off-resonance irradiation and non-uniform spin multiplicities are avoided. Along the same lines, ZZ-filter is preferred over gradient-sensitivity enhancement to avoid spurious magnetization transfer, which may obscure the zero crossing point.
If you protein completely lacks aromatic residues, you may use aliphatic signals instead. It is then recommended to shift the carrier from 35 ppm to 25, since it is mostly the methyl signals you will be looking at.
You can use two macros cof and nof to set dof and dof2 precisely to a given ppm position. The syntax is like cof(H1 center in ppm, desired C13 center in ppm). For example, cof(4.73,35) if one wants to set the center of C13 as 35ppm. The same holds true for nof. cof and nof are stored in the vnmrsys/maclib.
You can also keep calC=1.0. In this case the correct pwC will correspond to maximum intensity. This may be the better method for diluted samples, while the zero crossing method is preferred for concentrated ones.
15N and 13C 90° pulse widths are much less sensitive to salt concentration than 1H 90° pulse width.
Longer than usual pulse widths may indicate a poorly tuned and matched channel.
If the calibrated pulse widths are consistently calibrated long for different samples, it indicates a deteriorating probe.
Automated Calibration of 90° Pulse Widths (BioPack)
For every sample you should calibrate 90° pulse widths before acquisition.
Here we assume that you have BioPack installed. BioPack uses a probe file to store all important parameters for its library of biomolecular NMR pulse sequences. Your NMR facility manager should have prepared a fully calibrated probefile. Some parameters in the probefile depend only on the hardware. Other parameters, such as pulse widths, are sample-dependent and have to be calibrated for each sample to achieve maximum signal-to-noise. BioPack also provides tools, which automate the calibration of such parameters and update the probefile.
Depending on you sample's labeling scheme, concentration, etc. you should select from the methods below.
Upon completion of each calibration step related parameters (e.g. decoupling pulse widths, adiabatic pulses) are re-calculated and probefile is automatically updated with new values.
Automated calibration should be verified by analyzing its output. The output is controlled with the parameter BPplot:
- BPplot='plot' -output is sent to the printer/plotter; make sure you have them both defined.
- BPplot='file' - output is stored as PGL files in ~/BPplots/, these can be viewed with ggv on Linux. (recommended)
- BPplot='off' - no output. (not recommended)
You can also use the radio buttons in the Setup -> Calibrations tab, under Plotting Mode.
In the plotted arrayed spectra check the following:
- good SN
- proper spectra without artefacts
- smooth envelope with a maximum
- optimal pw90 is correctly determined from the maximum.
1H 90° pulse width only
Use this method if you sample is unlabeled (at natural abundance) or if its concentration is very low.
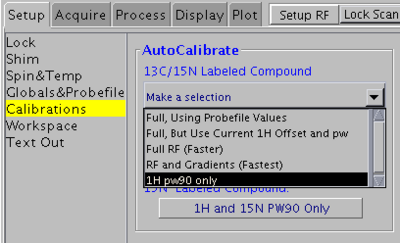
In VNMRJ window go to the Setup -> Calibrations tab and select 1H pw90 only from the pull-down menu.
1H and 15N 90° pulse widths
Use this method for 15N- or 15N/13C-labeled samples. Do not use for natural abundance samples.
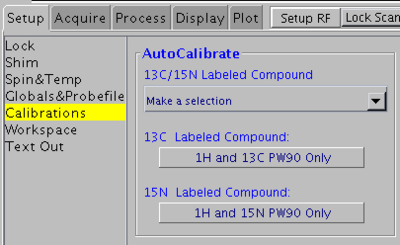
In VNMRJ window go to the Setup -> Calibrations tab and click on the 1H and 15N PW90 Only button. This method uses the gNfhsqc pulse sequence and looks for the signal maximum.
1H and 13C 90° pulse widths
Use this method for 13C- or 15N/13C-labeled samples. Do not use for 5% 13C-labeled or natural abundance samples.
In VNMRJ window go to the Setup -> Calibrations tab and click on the 1H and 13C PW90 Only button. See the picture above.
Depending on the BPquick parameter (see the corresponding checkbox under Setup -> Globals&Probefile tab) it will use either gCfhsqc or hcch_tocsy pulse sequence and looks for the signal maximum.
1H, 13C and 15N 90° pulse widths
Use this method for 15N/13C-labeled samples. Do not use for 5% 13C-labeled or natural abundance samples.
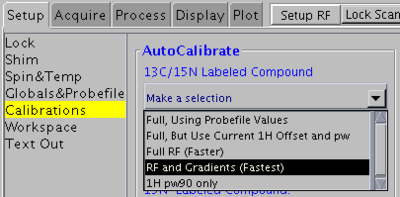
In VNMRJ window go to the Setup -> Calibrations tab and select RF and Gradients (Fastest) from the pull-down menu. This method will use the ghn_co pulse sequence for calibration. It will also calibrate coherence selection gradient amplitudes.
Coherence gradients do not usually change with time and do not depend on the sample. ghn_co is also less sensitive than gCfhsqc and gNfhsqc, and this method takes quite some time to run. It is more convenient to run 1H/13C, and 1H/15N calibrations in succession.
However, this is probably the only method to calibrate 13C 90° pulse width for DCN-labeled samples.


