Resonance Assignment/AutoAssign WebServer: Difference between revisions
No edit summary |
|||
| (6 intermediate revisions by one other user not shown) | |||
| Line 1: | Line 1: | ||
== '''Introduction''' == | == '''Introduction''' == | ||
In 2009, the members of the Rutgers group (Gautam Singh and Janet Huang) developed a freely accessible web version of AutoAssign, the [ | In 2009, the members of the Rutgers group (Gautam Singh and Janet Huang) developed a freely accessible web version of AutoAssign, the [http://nmr.cabm.rutgers.edu/autoassign AutoAssign WebServer]. This web version also provides a consensus approach for automated backbone resonance assignments to take advantage of both [[AutoAssign|AutoAssign]] and [[The PINE Server|PINE]] programs. The AutoAssgin web interface can submit jobs them to both AutoAssign server and PINE web-sever. It will immediately show the results from the AutoAssign server. Once the PINE results are available by e-mail, the user can then upload the PINE result into AutoAssign web interface. The AutoAssign web interface will then show a comparison chart where the user can easily find different resonance assignments between these two programs. This comparison chart can generally guide user for further investigation of resonances assigned differently by AutoAssign and PINE. The resonances assigned by both programs generally have higher accuracy confidences. | ||
<br> | <br> | ||
| Line 9: | Line 9: | ||
=== '''Submitting Jobs to AutoAssign and PINE''' === | === '''Submitting Jobs to AutoAssign and PINE''' === | ||
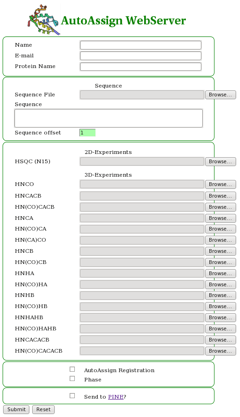
The AutoAssign WebServer interface is quite simple to use (Figure 1). The user uploads the protein sequence file (in single-letter format) and desired peak lists (in Sparky | The AutoAssign WebServer interface is quite simple to use (Figure 1). The user uploads the protein sequence file (in single-letter format) and desired peak lists (in Sparky or XEASY formats). Also the user has the option of choosing to perform an AutoAssign registration for setting tolerances, selecting phase if the input data has phase information, and to automatically send the input files to PINE for automated backbone resonance assignment as well (the user will be e-mailed the PINE results from NMRFAM). | ||
==== Figure 1: The AutoAssign WebServer Interface ==== | ==== Figure 1: The AutoAssign WebServer Interface ==== | ||
[[Image: | [[Image:AAwebserver fig1.png]] | ||
=== AutoAssign WebServer Results === | === AutoAssign WebServer Results === | ||
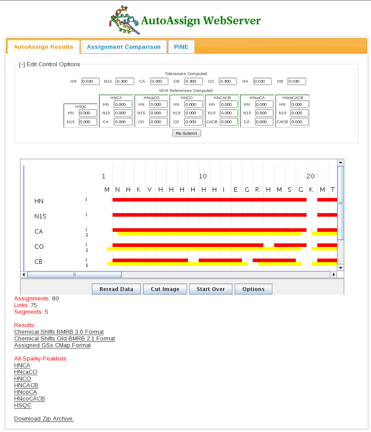
Once the calculations are complete, a results page appears (Figure 2). A connectivity map showing intraresidue (red) and sequential (yellow) assignments is displayed. In the page the user has the option to alter tolerances and global shift parameters and re-run the AutoAssign calculations. Assignment results in BMRB format as well as assigned peak lists for each spectrum in Sparky format can be downloaded from links in the bottom half of the page. | Once the calculations are complete, a results page appears (Figure 2). A connectivity map showing intraresidue (red) and sequential (yellow) assignments is displayed. In the page the user has the option to alter tolerances and global shift parameters and re-run the AutoAssign calculations; default tolerances are: <sup>1</sup>H, 0.03, <sup>15</sup>N, 0.3, <sup>13</sup>C, 0.3. Assignment results in BMRB format as well as assigned peak lists for each spectrum in Sparky format can be downloaded from links in the bottom half of the page. | ||
==== Figure 2: The Results Page ==== | ==== Figure 2: The Results Page ==== | ||
[[Image: | [[Image:AAwebserver fig2.png]] | ||
=== '''Comparing BMRB Assignments''' === | === '''Comparing BMRB Assignments''' === | ||
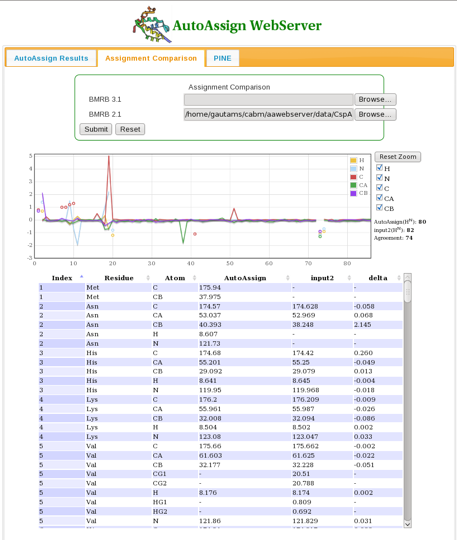
The user can compare chemical shift assignment files in BMRB format using the Assignment Comparison tab (Figure 3). Results showing chemical shift differences for each nucleus are plotted over the entire protein sequence. | The user can compare chemical shift assignment files in BMRB format using the Assignment Comparison tab (Figure 3). Results showing chemical shift differences for each nucleus are plotted over the entire protein sequence. | ||
==== Figure 3: The Assignment Comparison Page ==== | ==== Figure 3: The Assignment Comparison Page ==== | ||
[[Image: | [[Image:AAwebserver fig3.png]] | ||
=== '''Stand-Alone Assignment Comparison Tool''' === | === '''Stand-Alone Assignment Comparison Tool''' === | ||
Gautam has also written a stand-alone assignment comparison tool which can be accessed on-line at this [http://nmr.cabm.rutgers.edu/autoassign/compare link]. The user uploads bmrb files in either 2.1 or 3.0 format for comparison. At this point, tolerances for comparison of assignments are hard-wired in the code: <sup>1</sup>H, 0.02; <sup>15</sup>N, 0.2; <sup>13</sup>C, . | Gautam has also written a stand-alone assignment comparison tool which can be accessed on-line at this [http://nmr.cabm.rutgers.edu/autoassign/compare link]. The user uploads bmrb files in either 2.1 or 3.0 format for comparison. At this point, tolerances for comparison of assignments are hard-wired in the code: <sup>1</sup>H, 0.02; <sup>15</sup>N, 0.2; <sup>13</sup>C, 0.2. | ||
<br> | <br> | ||
| Line 39: | Line 39: | ||
<br> | <br> | ||
<br> | <br> | ||
Latest revision as of 23:31, 5 January 2010
Introduction
In 2009, the members of the Rutgers group (Gautam Singh and Janet Huang) developed a freely accessible web version of AutoAssign, the AutoAssign WebServer. This web version also provides a consensus approach for automated backbone resonance assignments to take advantage of both AutoAssign and PINE programs. The AutoAssgin web interface can submit jobs them to both AutoAssign server and PINE web-sever. It will immediately show the results from the AutoAssign server. Once the PINE results are available by e-mail, the user can then upload the PINE result into AutoAssign web interface. The AutoAssign web interface will then show a comparison chart where the user can easily find different resonance assignments between these two programs. This comparison chart can generally guide user for further investigation of resonances assigned differently by AutoAssign and PINE. The resonances assigned by both programs generally have higher accuracy confidences.
Using the AutoAssign WebServer
Submitting Jobs to AutoAssign and PINE
The AutoAssign WebServer interface is quite simple to use (Figure 1). The user uploads the protein sequence file (in single-letter format) and desired peak lists (in Sparky or XEASY formats). Also the user has the option of choosing to perform an AutoAssign registration for setting tolerances, selecting phase if the input data has phase information, and to automatically send the input files to PINE for automated backbone resonance assignment as well (the user will be e-mailed the PINE results from NMRFAM).
Figure 1: The AutoAssign WebServer Interface
AutoAssign WebServer Results
Once the calculations are complete, a results page appears (Figure 2). A connectivity map showing intraresidue (red) and sequential (yellow) assignments is displayed. In the page the user has the option to alter tolerances and global shift parameters and re-run the AutoAssign calculations; default tolerances are: 1H, 0.03, 15N, 0.3, 13C, 0.3. Assignment results in BMRB format as well as assigned peak lists for each spectrum in Sparky format can be downloaded from links in the bottom half of the page.
Figure 2: The Results Page
Comparing BMRB Assignments
The user can compare chemical shift assignment files in BMRB format using the Assignment Comparison tab (Figure 3). Results showing chemical shift differences for each nucleus are plotted over the entire protein sequence.
Figure 3: The Assignment Comparison Page
Stand-Alone Assignment Comparison Tool
Gautam has also written a stand-alone assignment comparison tool which can be accessed on-line at this link. The user uploads bmrb files in either 2.1 or 3.0 format for comparison. At this point, tolerances for comparison of assignments are hard-wired in the code: 1H, 0.02; 15N, 0.2; 13C, 0.2.


