RPF Analysis
Introduction
RPF is a modeule within the AutoStructure program that uses a novel, rapid, and simple approach for calculating global NMR structure quality scores (Ref. 1,2). This program calculates RECALL, PRECISION, and F-MEASURE (RPF) scores assessing how well the query 3D structure(s) fit to the experimental NOESY peak list and resonance assignment data. RPF scores quickly assess the goodness-of-fit of the query structure(s) to these experimental data, and can be used as a guide for further structure refinements. RPF also calculates discrimination power (DP) scores, which estimate the difference in F-MEASURE scores between the query structure and random coil structures, as an indictor of the correctness of the overall fold. The program is useful for quality of control protein NMR structures determined by automated or manual methods.
Definitions
There are four possible outcomes from the comparison of the query structures to the original peaklist (shown in the table)
- True Positive (TP) interactions are those observed both in the peak lists and final 3D structures;
- True Negative (TN) interactions are those that are neither observed in the peak lists nor in the 3D structures;
- False Positive (FP) interactions are those that are present in the 3D query structure but not present in the peak lists;
- False Negative (FN) interactions are those peaks observed from the experimental data set that are not accounted for in the 3D structure.
| NMR Data | Peak observed | Peak not observed |
| Interaction retrieved by Query Structures | TP | FP |
| Interaction not retrieved by Query Structures | TN | FN |
- Recall (R) measures the percentage of peaks that are retrieved by the algorithm and are thus part of the query structure.
- Precision (P) measures the fraction of retrieved proton pair interactions in the query structure whose back-calculated NOE peaks are part of the original peak list.
- F-measure (F) which takes both Recall and Precision into account reflects the overall performance score of the structure.
- Discriminating Power (DP) score, is a normalized F-measure statistic, is also developed to account for lower-bound and upper-bound values of the Fmeasure that are indicated by the NMR data quality and completeness.
Applications
Comparing Recall and Precision scores during the course of a structure refinement can help to improve the peak picking process and/or identify errors in the input data, allowing refinement of the input used in the structure determination process. Generally, a reduced Recall rate compared with the Precision rate may suggest the existence of noise peaks in the input data set. High Recall rate compared with the Precision rate suggests that some weak NOE cross peaks have not been included in the NOESY peak lists because the corresponding signal-to-noise ratios are low. Good quality structures should have high Precision rates (few short inter-proton distances that do not have corresponding NOEs in the peak lists). Factors that could cause low Precision scores include surface amide proton saturation transfer, solvent exchange broadening, and conformational exchange broadening. The F-measure score provides a good measure of the overall fit between the query structure and the experimental data, while the DP score measure how the query structure is distinguished from a freely rotating chain model, accounting for data quality. Low F-scores indicate that the structure does not fit well with the input data. High F-scores and low DP-scores indicate that the NMR data does not have enough long-range information that can distinguish the structure from a freelyrotating chain model. Structures with F-measure > 0.9 and the DP score > 0.7 correlates to structures having accuracies of < ~ 2 Å rmsd.
Preparing Input Files
Create a new input directory (like autostructure/inputQ).
The input files are the same as for structure calculation. In addition you'll need a coordinate file:
- NOESY peak lists
- Chemical shift file
- Sequence file
- Control-file
- 3D structure coordinates in a single PDB file
Peaklists
Like AutoStructure, peak lists in either Sparky or Xeasy formats can be used with the RPF program.
For a typical CYANA run, copy the latest peaklists from manual CYANA 2.1 structure calculation.
AutoStructure 2.0 and higher versions require a single peaklist for 13C-resolved NOESY. If you are using separate aliphatic and aromatic peaklists you need to combine them in a single peaklist.
For XEASY peaklists you can use the the attached pks.awk script to renumber the aromatic peaks, then concatenate the result with the aliphatic peaklist:
pks.awk < aro.peaks > tmp
cat ali.peaks tmp > c.peaks
Sequence and Chemical Shift Files
If you have modified chemical shift assignments (e.g., moved spins, added new spins) during structure refinement you should create a new chemical shift file for AutoStructure as described in Running AutoStructure. Otherwise, you can reuse the previous chemical shift file.
The same holds for the sequence file, though it is highly unlikely that one would need to modify a protein's sequence during refinement.
Control File
The control file is essentially the same as the one used for automated AutoStructure calculation. You may need to do the following:
- change peaklist names and paths.
- if using separate aliphatic and aromatic peaklist - remove the aromatic peaklist entry.
- comment UPL and ACO entries as they are irrelevant.
PDB Coordinate File
Use PDBStat to convert your coordinate file to IUPAC atom nomenclature. Start pdbstat and type the following commands:
read coor pdb All_KKK_cns.pdb- Type
allat the prompt to read all conformers. to iupacwrite coor pdb XXXX_ref.pdb
Here we assume that the output of CNS is =All_KKK_cns.pdb.
AutoStructure is sensitive to the atom name nomenclature of the PDB input file. In the output directory (e.g. calcQ) check the contents of the XXXX_NA.note file to see if the PDB file has been read correctly.
Using AutoStructure in shell mode
To start RPF analysis type
autostructure -c control-file -o calcQ -q XXXX.pdb
The scores will be reported in the overview (*.ovw) file in the output directory.
Using AutoStructure in GUI mode
AutoStructure version 2.1.1 and higher has a GUI for RPF analysis providing additional features. However, older Linux systems may not have the proper graphics libraries to support it.
The RPF interface (From AutoStructure interface) provides a useful interface for the user to calculate RPF scores. Structures determined by manual or automated analysis, homology modelling, or X-ray crystallography can be used for RPF scores calculations.
To run: type asgui
Start the RPF calculation and open the output
For one pdb file: select from menu: AutoQF(RPF) -> Calc -> One
For AutoStructure Output directory: select from menu: AutoQF(RPF) -> Calc - > For AutoStructure Output Dir
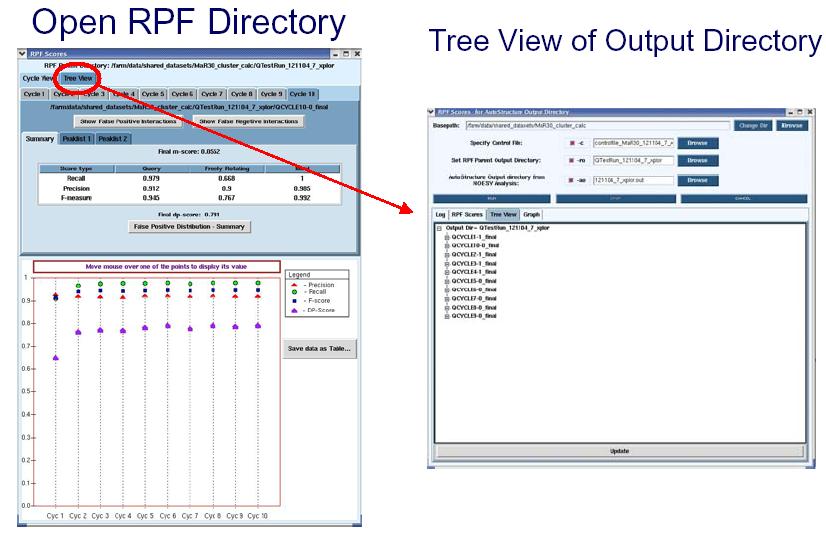
Open Output: select from menu: AutoQF(RPF) -> Open RPF directory
Quality control for iterative cycle analysis using the output of AutoStructure
RPF scores can be used as a quality control in iterative cycle analysis of protein structure determination in NMR. The RPF interface (shown in the figure below) displays the results of the iterative cycle analysis of NMR structure determination as a plot of the RPF and DP scores. The significant increase in the DP score from cycle 1 to cycle 10 demonstrates the improved accuracy of the final structure when compared to the initial and intermediate cycles. By the final cycle the F-measure is > 0.9 and the DP score is > 0.7 which correlates to structures having accuracies of < ~ 2 Å rmsd. During the iterative refinement process, as long as the structure does not have many bad proton-proton packing interactions, the Precision rate should be high and stay relatively constant. The below figure shows that Precision rates decrease slightly during the iterative process. This is due to the increased compactness of the structure over the course of the refinement, when additional weak NOE cross peaks predicted are missing from the input NOE peak lists (False Positives). The small decrease in precision over the course of refinement is diagnostic of the quality and completeness of the input NMR data. In AutoStructure 2.4.0, RPF scores for individual models in the structural ensemble are also reported.
False Positive distribution
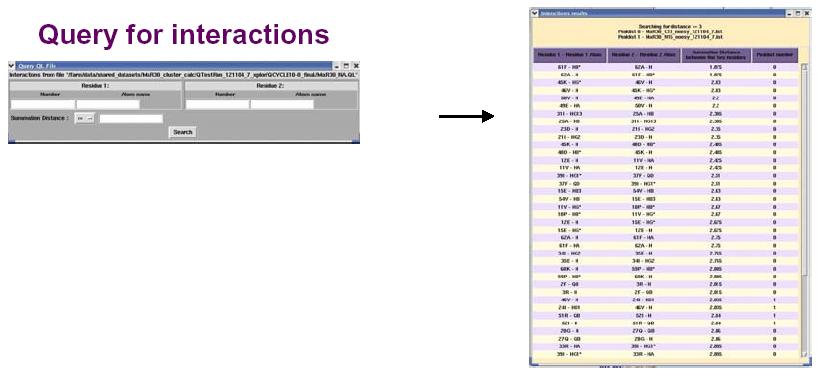
The figure above shows the False Positive distribution in a protein as presented by the RPF interface. The color coded regions in the 3D structure represent areas with False Positive interactions; false positive interactions are those interactions that are present in the final query structures but not part of the input NOE peak lists. RPF maps the distribution of false positive interactions into the query structures. Precision measures the fraction of NOE interactions predicted by the structures and are also observed in the input NMR data. Thus, a higher the Precision corresponds to a lower number of false positive structural features. The graphical tool RASMOL is used to display the ribbon diagram of the query protein structure with color coded showing the missing interactions ranging from red (most problematic) to blue (least problematic) (shown in the above figure). The interface also provides a tabular view of the detail interactions given two residue numbers. A Sparky peak list can be generated from these false positive interactions. Chemical shifts are generated from the resonance assignments. These false positive interactions can be queried with a query tool as shown in the figure below. One can query for false positives by residue or below a given interproton distance.
False Negative Interactions
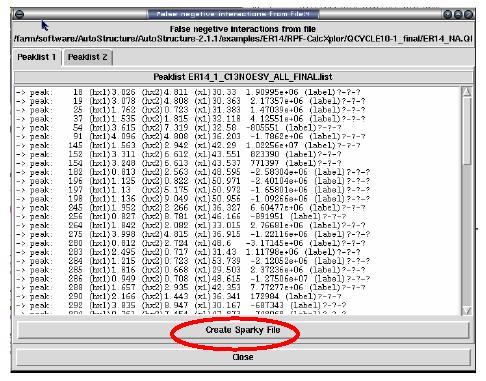
The interface for RPF also provides a display for those interactions that are present in the original input NOE peak list that do not have corresponding interactions in the final 3D structures (see figure below). These false negatives can then be used to evaluate the quality of the structure or the input NOE data. A Sparky peak list can also be generated from these false negative interactions.
References
1. Huang, Y.J., Powers, R. and Montelione, G.T. (2005) Protein NMR Recall, Precision, and F-measure scores (RPF scores): structure quality assessment measures based on information retrieval statistics.J. Am. Chem. Soc. 127, 1665-1674.
2. Huang, Y.J., Tejero, R., Powers, R. and Montelione, G.T. (2006) A topology-constrained distance network algorithm for protein structure determination from NOESY data, Proteins 62, 587-603.
-- GaohuaLiu - 20 Jun 2007
--Updated by JimAramini- 03 Nov 2009
pks.awk : awk script to renumber peaks from a peaklist


